
Gen Z Didn’t Stop the Red Wave
Gen Z Didn’t Stop the Red Wave
One of the main narratives about the 2022 midterms is wrong.

With the start of the new year, things are going to be changing around here. From now on, you can expect to get posts 2x per week, on Tuesdays and Fridays.
I’m ramping things up because I want to give this blog/newsletter thing a real shot rather than having it merely a side hobby.
The main task right now is to grow my number of readers. So here’s what I’ll ask: If I write something that you find interesting, please consider passing it along to a friend/family member/colleague.
— Seth
I’m not really what you would call a “math guy.” By far, my worst grade in high school was in Calculus, and I worked very hard in college to avoid taking a single math class.
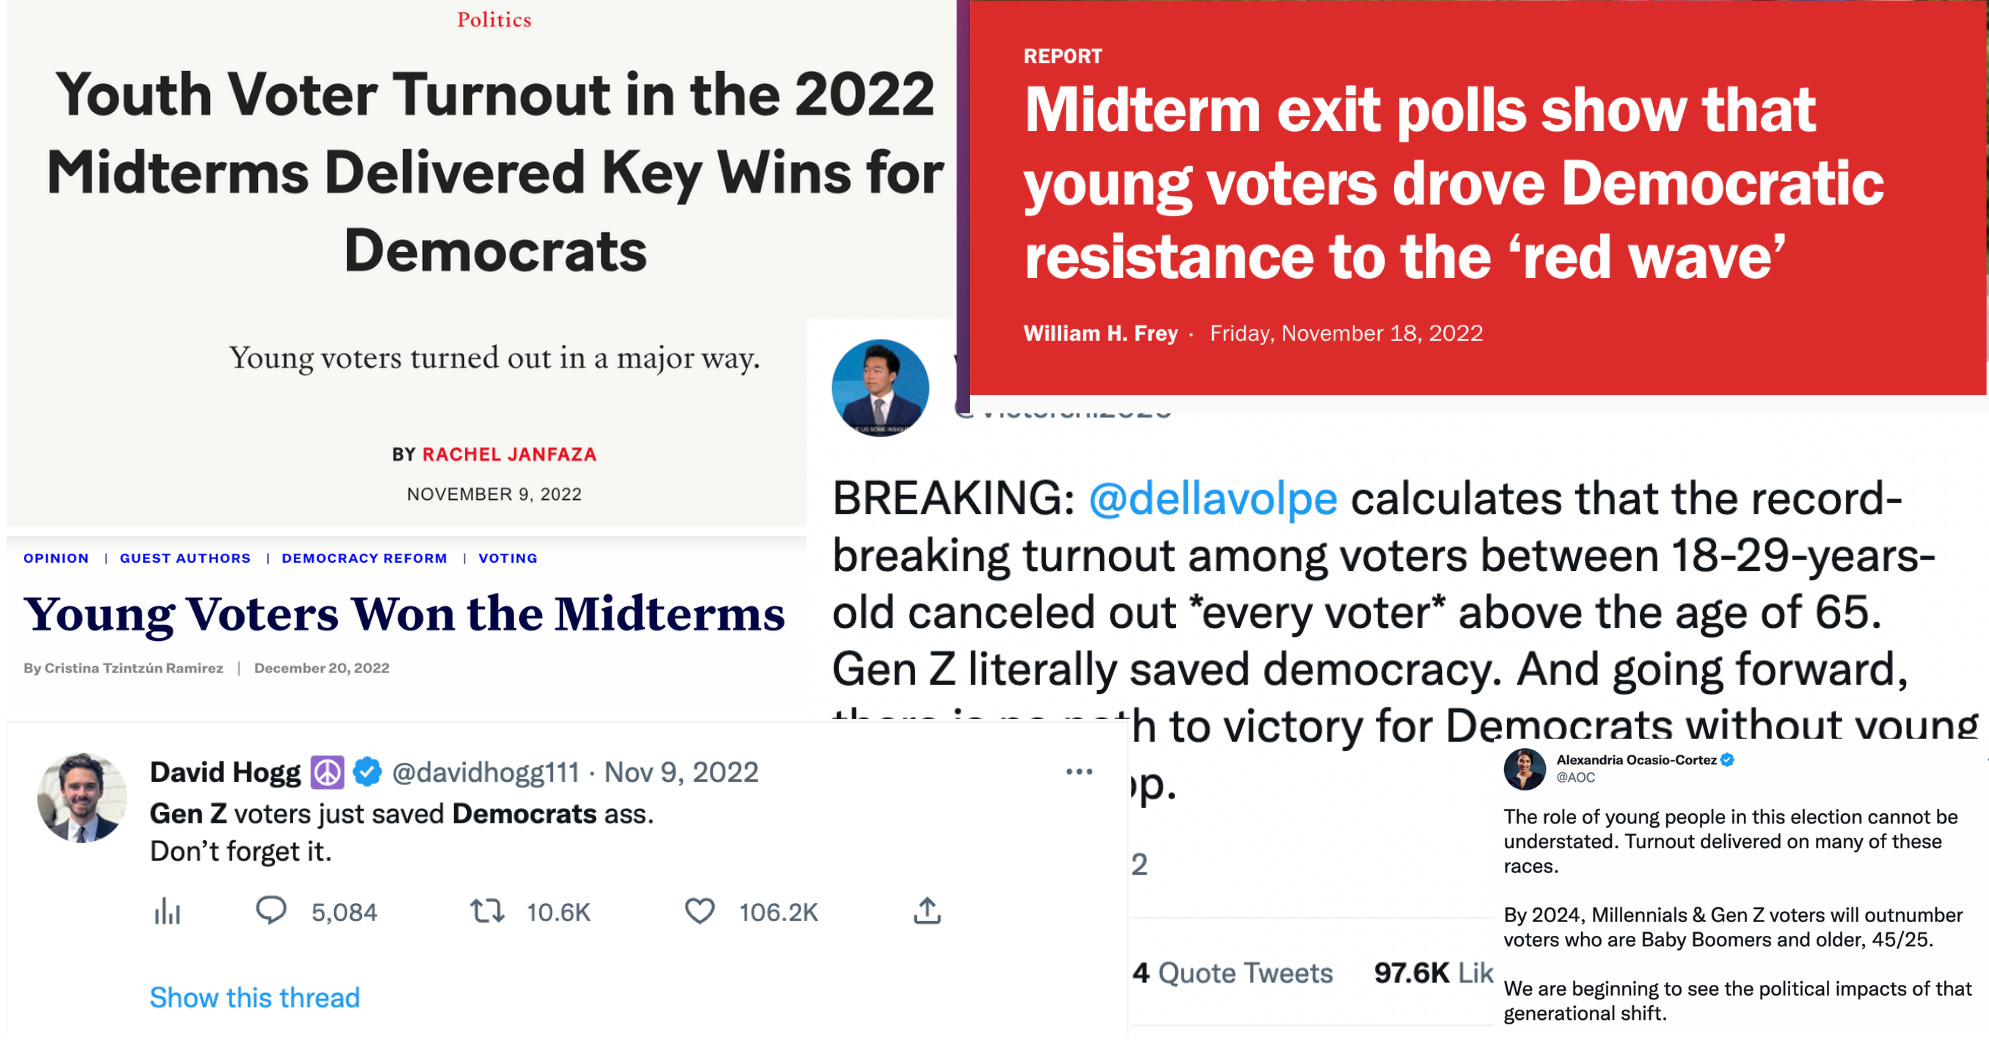
And yet, even I could tell that there was something off about one of the main statistical narratives that came out of the midterm elections — that Gen Z stopped the red wave. If you’re on Twitter, you may have seen tweets like these:


The narrative wasn’t isolated to Twitter. Many establishment media outlets published articles making the same point:
Brookings - “Midterm exit polls show that young voters drove Democratic resistance to the ‘red wave.’”
Teen Vogue – “From John Fetterman’s victory over Mehmet Oz in Pennsylvania and incumbent senator Maggie Hassan’s success in New Hampshire to incumbent governors Gretchen Whitmer and Tony Evers’s wins in Michigan and Wisconsin, Gen Z and younger millennial support of Democratic candidates appeared to be crucial in fending off Republican victories in key states.”
Democracy Docket - “It is clear that if young people didn’t turn out at a historic rate — 27% nationally, the second-highest youth voter turnout in almost three decades — Republicans would have destroyed Democrats this cycle.”
But something about the way this argument was being presented just seemed odd. Very few of the articles marshaled much statistical evidence at all, and it seemed unlikely that an increase in turnout among such a small slice of the electorate could really be enough to change the outcome of the midterms.
Weirdly, save for a few ambivalent articles and skeptical tweets, there was very little I could find in terms of actual analysis trying to determine how much youth turnout affected midterm results. And so I decided I would stretch my arithmetic skills and try to determine whether or not it was Gen Z that stopped the red wave.
To do that, the first question we need to answer is if youth turnout increased at all, and if it did, by how much. After that, we can look at how much this affected actual election results.
Was there an increase in youth turnout?
Most of the articles making the case that Gen Z stopped the red wave relied on a few shared data points. First, that youth turnout (meaning voters 18 to 29)1 was 27%. The statistic comes from Tuft’s Center for Information & Research on Civic Learning and Engagement and seems to be well-founded. The second data point that was repeatedly marshaled was that this age cohort voted for Democrats over Republicans 63% to 35%. This statistic comes from Edison Research National Exit Poll, and is a bit more shakey. The other main national midterm survey from AP Vote Cast has this number at 53% to 41%. That’s a big and important discrepancy (which we’ll discuss in a bit), but both numbers nevertheless show Democrats leading by a substantial margin among young voters.
While this information does show us that 1) young people are more energized than they were a decade or two ago and 2) that young people vastly prefer Democrats to Republicans, it doesn’t actually give enough context or information to assess the claim that an increase in youth turnout made a tangible difference in election results.
Below is a chart showing the youth turnout (in dark pink) and general population turnout (faded pink) for every election from 1988 to 2022.

There are a few things that jump out. First, that youth turnout is always significantly lower than general population turnout, usually by 15% to 20%. Second, that turnout in presidential years is always higher than in midterm years, also usually by about 15% to 20%.
Because 2022 was a midterm year, it makes sense to compare it only to other midterm years. Below is a chart showing turnout in midterm elections from 1990 - 2022.

This chart makes it much easier to see how 2022 fits into the historical trend. From 1990 - 2014, youth turnout stayed around 17% - 20%. Then, in 2018, when Democrats were fired up in the midst of the Trump presidency, there was a big jump in youth turnout to 33%. Then, in 2022, turnout fell to 27% — down from the peak in 2018, but significantly higher than in the pre-Trump era.
This trend was mirrored by the general population, which had a spike in turnout in 2018 and a slight drop in 2022. But because the general population turnout and the youth turnout followed the same trend in 2018 and 2022, it’s hard to know if youth turnout was an outlier in any way, or if it simply followed the national trend.
To answer this, I made a graph charting youth turnout as a proportion of general population turnout.

While young people still showed up at a much lower rate than the rest of the population, they made up serious ground in 2018. In 2014, for every 100 Americans of all ages who voted, only 44 young people did. In 2018, that proportion jumped to 65. And in 2022, it fell to 58 — lower than the previous midterm, but still high relative to other recent elections.
Now that we have a bit of context, we can answer the main question: how much did an increase in youth turnout change the midterm results? Before we move on, though, let’s recap:
Young people vote at a much lower rate than the general population.
Both young people and the general population saw a turnout spike in 2018, when everyone was hopped up over the Trump presidency.
Both young people and the general population saw a turnout drop in 2022 compared to 2018, but it was still higher than all other years.
Relative to the general population, young people turned out at a much higher rate in 2018 than in previous years. That proportion dropped in 2022, but stayed higher than what was typical pre-2018.
How much did youth turnout affect election results?
Alright, now is the time for a bit of math. If you’re not interested in the specifics, feel free to skip ahead to after the indented section. Still, I wanted to show my work, so I’m doing that here.
First, using the Edison Research National Election Pool exit poll, we see that young voters chose Democrats over Republicans 63% to 35%. That’s a margin of 28%.
Second, using the work of Political Scientist Michael McDonald, we see that young people typically made up 10% - 11% of the electorate in elections from the late 1990s to mid-2010s. In 2018, this changed and young people made up about 14% of the electorate. In 2022, according to the New York Times, young people made up about 12% of the electorate. (McDonald’s data set isn’t updated to include 2022, which is why I used the Times number, although you can calculate the same 12% by using the relative turnout rates from the “Relative Turnout” chart.)
Third, if Gen Z made up 12% of the electorate in 2022, and gave Democrats a margin of 28%, that means that they pulled a neutral national environment 3.4% to the left. (28 *0.12 = 3.4) (Technically, the national environment wasn’t perfectly neutral — Republicans won the popular vote by about 3% — but this number is difficult to measure perfectly for a number of reasons and is close enough to 50/50 that I’m not factoring it in and that it won’t substantially change final results.)
Fourth, if Gen Z’s share of the electorate grew from ~10% of the electorate to ~12% of the electorate, we know that the increase in youth turnout drove ⅙ of the 3.4% Democratic margin, which equals 0.57%.
Fifth, all this is based on Edison Research’s number. AP VoteCast shows young voters choosing Democrats 53% to 41%. Doing the same math, that 12% margin would show that youth turnout drove 0.24% of the Democratic margin.
So there we have it: if we use the average turnout of the late 1990s to mid-2010s as a benchmark, consider only the increase in youth turnout that went above and beyond the increase in general population turnout, we find that the increase in youth turnout helped Democrats’ national margin somewhere between 0.24% and 0.57%.
Was this boost big enough to tip any races?
Looking first at the Senate, the narrowest Democratic victories were in Nevada (with a margin of 0.78%), Georgia (3%), Arizona (5%), and Pennsylvania (5%). The closest Democratic gubernatorial victories were in Arizona (0.66%), Kansas (2.1%), and Wisconsin (3.4%). And in the House, the tightest seats Democrats won were CO-8 (0.69%), NM-2 (0.7%), CT-5 (.79%), and WA-3 (0.83%). Altogether, there weren’t any House, Senate, or Gubernatorial elections within the 0.24% - 0.57% range that would have meant youth turnout was decisive.
Of course, each election has its own individual dynamics. Perhaps one or two of the nation’s elections did see youth voter turnout that was strong enough to tip the scales. But I don’t think that’s the case, because even in the battleground states listed, the youth share of the vote didn’t rise above 13% (in Georgia), and in several other key races was actually below the national 12% average.
In short, youth turnout did not stop the red wave.
A failure of journalism
It really is amazing that so many prestigious media outlets got this story so wrong. I’ll go over just two examples and then try to understand why mistakes like these were made.
The first is a more minor factual error. One piece in The Hill said that “Since the 1990s, participation in midterm elections hovered around 20 percent for young voters, though that total grew in 2018 and the trend continued in 2022.” But this is just factually wrong: the trend did not continue in 2022, when youth turnout was nearly 6% lower than it had been in 2018.
The second example which comes from Yahoo News is more egregious. It’s from an article titled “‘Young voters delivered for Democrats': How the youth vote blocked a 'red wave' in midterms.” In this piece, the reporter quotes an activist and treats her word as fact, rather than taking the time to verify if it’s true or makes sense. Here’s the relevant section of the article:
Last week the youth vote impacted key races in battleground states.
For instance, in Georgia, “the number of votes between Sen. [Raphael] Warnock and his opponent in Georgia were less than 50,000 votes,” said Kiesa. “But if you look at the estimated number of votes cast from young people, Sen. Warnock [received roughly over] 100,000 votes from young people in the state of Georgia.”
And in the Arizona governor’s race, the only gubernatorial race where votes are still being counted, the youth vote is also a factor. “If you look at the margins in the Arizona governor's race, those are below 25,000 votes. Our current estimates — and votes are still being counted there — are that young people passed at least 50,000 votes there,” Kiesa said.
At first, this seems reasonable. But, if you take a second to think about it, it’s either totally disingenuous or completely confused. First, the numbers in Georgia and Arizona are referencing different things: In Georgia, it’s how many people voted for Warnock while in Arizona it’s the total number of young people who voted. Second, neither of these numbers clarifies how many of these votes are due to an increase in youth turnout over baseline expectations. Third, a good portion of young voters (around 35% to 40%) in each of these states also voted for Republicans. The article obfuscates all these points, implying instead that Warnock can credit the increased youth turnout to have expanded his margin by 100,000 votes and that Kelly can do the same with 50,000 votes—which is just totally wrong.
The fallaciousness of the argument is laid bare when you realize that you could make the same claims with basically any demographic group. Just plug any demographic into the above quote and it makes my point. Watch me do it with the demographic of “not married” people: in the Arizona governor’s race … the not-married vote is also a factor. If you look at the margins in the Arizona governor's race, those are below 25,000 votes. Our current estimates … are that not married people passed at least 1,000,000 votes there.
Strangely, I haven’t heard anybody make the argument that Mark Kelly’s victory is due to a surge in not-married people voting.
I think there are two main reasons why everyone got this story so wrong. The first is that a lot of reporters simply aren’t data journalists, and when they hear an argument repeated over and over again that relies on statistics, they just assume that it’s true.
The second reason I think the media got this story so wrong is that older people like to put their faith in the younger generation. There’s something exciting about the idea that the rising generation of young Americans will shock the political system, and that all we have to do is wait for them to become a bit older and a larger share of the electorate.
This, I think, is wrongheaded. People have thought this would happen going all the way back to the Silent Generation. But time and time again, as young voters age, they become more conservative. There is some evidence that Millenials and Gen Z may be breaking this trend, but it’s really too early to say. Anybody assuming that young people will bring a permanent progressive majority is likely doing so out of hope rather than out of rigorous analysis. I think a similar kind of wishcasting is what led so many activists, analysts, and journalists to fall for the false theory that youth turnout stopped the red wave.
Some might say that this is all nitpicking. But there are both practical and philosophical reasons why it is important to understand the electorate. If politicians don’t understand their constituents, they won’t be able to effectively represent them or their interests. If campaigns don’t understand the electorate, they’ll waste campaign resources targeting the wrong voters with the wrong message. If activists and organizers misunderstand what wins elections, they’ll be less effective.
In other words, for democracy to work, we need to know who is voting and why they are voting that way. The more we get those basic facts wrong — whether out of laziness or self-interest or wishcasting — the more our democracy is just a bunch of people groping around in the dark.